|
fx - EXTENDED SETTINGS |

|

Version 2.5.84, 07.12.2017 |
fx - EXTENDED SETTINGS
|
fx - EXTENDED SETTINGS |
|
Version 2.5.84, 07.12.2017 |
Data Caching Format Marker Simplify Maps Design Menu Selection Miscellaneous Chart Polygon Radial Spheres LineBars Layer Animation |
 click to expand |
The values for nearly all features may be entered as calculated formulas or variables. |
For detailed information about notation in this dialogs go to chapter The fx‑editor. |
EXTENDED SETTINGS |
|||||
|---|---|---|---|---|---|
SETTING / VALUES |
EXPLANATION |
||||
|
|
||||
This setting allows to enable the entire NPGeoMap object or to control the data loading. |
|||||
loaddata true object enabled, data is loading (default) false object disabled, no data is loaded |
Here you can set a condition that must be met in order to activate the NPGeoMap object and load the data or not. Example: |
||||
loaddatamessage content content shown in the NPGeoMap object, if loaddata is false |
If loaddata is set to false, the content defined in this feature will be shown in the NPGeoMap object. The content can be edited with HTML. |
||||
ordermarkerexpression text QlikView Expression by wich the marker table should be sorted. |
Changes the sort / order of the marker table. Use a QlikView expression, such as: sum (SALES) to display the low-markers over the high-mark markers. If the order is to be sorted descending, add * -1 to the formula: sum (SALES) * -1 The formula must be entered as text, example: "ordermarkerepression": "sum (SALES)" |
||||
Feature for setting QlikView variables for further use in QlikView objects. The variables are filled with a click on an object or a legend segment in NPGeoMap with the respective values. |
|||||
popupvariables |
Below three variables can be defined each for Markers, Polygons and Lines/Paths. Example Polygon: Example Legend: A simple click on an object is the trigger for filling the variable. Basically this feature is enabled as soon as the variables are set in the QlikView application as well. Make sure to press F5 for a refresh after setting the variables, in order to let the changes take effect. The best is to use aggregation formulas for limiting the displayed values within QlikView expressions: Sum({<ID = {$(#NPG_MarkerValues)}>} sales) This Example sums up all "sales", where the ID contains the values from the element list of the variable NPG_MarkerValues. You can find more information about this formula in the QlikView Manual in chapter "Set Analysis". In this way QlikView charts and visualizations can be steered by NPGeoMap and displayed in its PopUps. |
||||
marker text name for the Marker variable (default is NPG_MarkerValues) |
Name for the variables. markers polygons lines/paths |
||||
polygon text name for the Polygon variable (default is NPG_PolygonValue) |
|||||
line text name for the Line and Path variable (default is NPG_LineValue) |
|||||
|
|||||
maps path custom map file path |
This feature allows to store map files in a customized place, even on an external server. Map files in NPGeoMap are loaded from the path you set here. |
||||
|
|
||||
|
|||||
savecachedmapsfromserver 0 Maps are not saved 1 Maps are saved - better performance (default) |
By default NPGeoMap works with a system that caches the Maps (used in the object) and saves it inside the browser memory. This increases the performance a lot, especially when big map data is used. |
||||
maxcachedays number maximum duration of keeping maps in cache in days (default is 0) |
This setting may restrict the one above to a specified duration. |
||||
|
|
||||
General format settings for calculated numbers in NPGeoMap such as the displayed numbers in the legend, in selection areas or distance information. |
|||||
currencysymbol character basically used currency symbol (default is the Euro sign "€") |
Defines the basically used currency symbol in NPGeoMap. |
||||
numbers format basically used number format (default ist 0,0.00) |
Configures the general format and notation of calculated numbers in NPGeoMap such as numbers in the legend, in selection areas or distance information. comma , = thousand separator dollar sign $ = currency symbol In Addition space characters and other symbols can be used directly. Example (Screenshot on the right): "numbers": "$ 0,0", Further examples: INPUT "numbers": OUTPUT _ 1500.25 "0,0.00" 1.500,25 1500.25 "0" 1500 1500.25 "0,0.000" 1.500,250 1500.25 "$ 0,0.00" € 1.500,25 0.9 "0,0.00 %" 90,00 % 0.9 "0,0%" 90% The used characters for the thousand and the decimal speparator are assumed from the settings in the QlikView Skript. |
 click to expand |
|||
|
1 use metric units in NPGeoMap (default) 0 use miles and feet in NPGeoMap |
Defines the basically used unit system for calculated numbers (like the displayed numbers in the legend, in selection areas or distance information) in NPGeoMap: 1 = use metric system (default) meters, kilometers 0 = US/UK system (United States customary units/Imperial units) miles, feet Only distance information on Lines and Paths is overwritten in the fx‑EXTENDED MAP SETTINGS with the feature unitsFactor due to historical circumstances. |
 click to expand |
|||
 click to expand |
|||||
|
|
||||
|
|||||
renderemptycoordinates 0 faulty coordinates won't be displayed (default) 1 faulty coordinates will be displayed at zero |
Faulty Marker coordinates just won't be displayed by default. They are faulty, if either the latitude or the longitude is missing or even both. Therefore all faulty Marker coordinates can be located easily. Since PopUps automatically sum up Markers that are located exactly at the same point, you can enable them in the settings and then just read out which Markers are affected. |
||||
proj4definition text "Proj4" code of used Marker coordinates format |
If the Marker coordinates are not in WGS84 format, the actual format can be used by setting the so called "Proj4" code (of respective map projection) here. Example: "proj4definition": "+proj=lcc +lat_1=35.25 +lat_2=36.41666666666666 +lat_0=34.66666666666666 +lon_0=-86 +x_0=609601.2192024384 +y_0=30480.06096012192 +ellps=clrk66 +datum=NAD27 +to_meter=0.3048006096012192 +no_defs"
 click to expand Learn more about Proj4 on the Internet. |
||||
|
|
||||
Features for simplifying maps and to reduce their resolution, in order to optimize loading time. |
|||||
active true feature enabled, maps can be simplified (default) false feature disabled |
By enabling this feature it is possible to simplify the maps/polygons used in NPGeoMap. This feature is related to the Resolution in the menu group Dynamic Map Layer or the same in Static Map Layer. By enabling SimplifyMaps the Resolution tool is enabled as well (if disabled you can still fill in values, but is has no effect on the programm). |
||||
simplifytype 0 currently only type 0 is available |
The filled in type defines the method of evaluating which coordinate points can be deleted and which not. |
||||
tolerance number maximum distance between two coordinate points (default is 5000) |
This feature defines the maximum distance between two coordinate points - the unit depends on the data source. Example: |
||||
|
|
||||
|
|||||
backgroundcolor color Background color in the object (standard is white) |
Defines the background color in the NPGeoMap object. |
||||
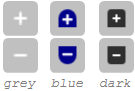
theme grey zoom buttons are displayed in style gray (default) blue zoom buttons are displayed in style blue dark zoom buttons are displayed in style dark |
This feature defines the style of the zoom buttons.
|
||||
|
[coordinates] graphical vector coordinates for Line Arrow style (default is [0,10, 10,10, 5,0, 0,10]) |
This feature allows to change the predefined Arrow style, displayed on Lines and Paths. Use [x,y] coordinates, separated by comma, to draw the shape. Axis x goes from left to right and y from top to bottom. For example [0,0, 10,0] draws a straight line from left to right 10 units long. Enter the vector coordinates in relative proportion. The actual size of the Arrow is still defined with ArrowSize in the Arrow Settings (inside Dynamic Marker Settings). Example default Arrow: "linearrowstyle": [0,10, 10,10, 5,0, 0,10], Example slim Arrow: "linearrowstyle": [0,8, 5,0, 10,8, 5,2], |
default Arrow: click to expand |
|||
slim Arrow: click to expand |
|||||
Create a offset for the Arrow Example Arrow with offset (image below): "linearrowstyle": [3,0,3,6,0,12,3,7,6,12,3,6],  click to expand Background info: |
|||||
selectedpolygoncolor color color of marked Polygons during selection (default is lightgrey) |
This color is used as fill color for marked Polygons while making a selection - this means before you release the control key or confirm in touchscreen menu with the green OK button, selected Polygons are marked with this color. When selection is done, they turn back to their original color. When setting colors you can use Hex-Codes, HTML color names or RGB |
||||
selectedmarkercolor color color of marked Markers/Endmarkers and Radial Spheres during selection (default is grey) |
The same as above applies here for Markers, Endmarkers and Radial Spheres - in other words for all items built on a single coordinate. When setting colors you can use Hex-Codes, HTML color names or RGB |
||||
MouseOvers or Tooltips are small fields with short information which appear when the cursor hovers over a dynamic object in the map. |
|||||
showdelay number delay of MouseOvers in milliseconds (default is 400) |
Defines a delay of displaying MouseOvers (Tooltips). |
||||
hidedelay number duration of MouseOvers in milliseconds (default is 5000) |
Defines the duration the MouseOver (Tooltip) is displayed. |
||||
|
|
||||
In this section are various settings for optimizing the user interface, like configuring the menu bar, the touchscreen menu, the selection menue or other operating elements. Furthermore there's a setting for the language in NPGeoMap and a special button which can automatically allocate Markers to their respective geographically related Polygon. All menu items can be combined arbitrarily. Only "active" (the menu bar) and "touchscreenmenu" have a either-or relation, whereby the second one has priority. |
 click to expand |
||||
active 1 menu bar enabled (default) 0 menu bar disabled |
Displays the Menu Bar. |
 click to expand |
|||
touchscreenmenu 1 touchscreen menu enabled (default if a mobile device is detected) 0 touchscreen menu disabled (default) |
Displays the Touchscreen Menu. |
 click to expand |
|||
|
1 Layerswitcher enabled (default) 0 Layerswitcher disabled |
Displays the Layerswitcher. Further below in this dialog a custom name can be configured for each layer. This name will be displayed in the Layerswitcher. |
 click to expand |
|||
 click to expand |
|||||
zoom 1 zoom buttons enabled (default) 0 zoom buttons disabled |
Displays the Zoom Buttons. |
 click to expand |
|||
|
1 help button enabled (default) 0 help button disabled |
Displays the Help Button. |
 click to expand |
|||
helptype 1 offline PDF help 0 online WEB help |
When clicking on the Help-Button either a website (online manual) or a Pdf document (offline manual) will be opened. |
|
|||
|
1 Animation Menu Bar enabled, when Animation is set (default) 0 Animation Menu Bar never visible |
Displays the Animation Menu Bar.
|
 click to expand |
|||
|
1 Selection Menu and Selection enabled (default when selectable items are configured in the object) 0 Selection Menu and Selection disabled |
Displays the Selection Menu and enables or disables the Selection itself. The Selection Menu and the Selection are enabled by default, but the menu only appears when selectable (dynamic) items and layers are configured in the object. General details about selecting in NPGeoMap see chapter User Interface. |
 click to expand |
|||
|
1 toggle selection flip switch enabled 0 toggle selection flip switch disabled (default) |
Displays a flip switch beneath the selection menu, to switch between default selection mode and toggle selection mode. oToggle selection - same selection dynamics as in Qlik Sense: oDefault selection - same selection dynamics as in QlikView: Using this flip switch overwrites the configurations in the feature togglemode further below. |
 click to expand |
|||
|
1 Button enabled 0 Button disabled (default) |
This button enables a feature for automatic allocation of Markers to their respective geographically related Polygon. In this way Markers and Polygons on a map can be connected just because of their geography. To defines if a Marker on two or more overlapping Polygons is assigned uniquely to one Polygon or to each of them, see the feature markerinpolygonsuniqueassign further below. |
||||
 click to expand |
|||||
|
text used language in NPGeoMap - if not set, the automatically determined language will be used |
Setting of the used language in NPGeoMap - if not set, the automatically determined language will be used. Example: Make sure to press F5 for a refresh after setting this feature, in order to let the changes take effect. |
||||
|
|
||||
Settings concerning features for performance and presentation of selecting and marking (selection drawings) in NPGeoMap. |
|||||
markerdimensionlistbox QV-listbox ID ID of the QlikView Listbox containing the Dynamic Marker Dimension empty value feature disabled (default) |
This feature changes the way the selection works and causes a huge performance benefit. Technical background: When using this feature, the selection won't be made by NPGeoMap but by the QlikView Listbox. NPGeoMap just determines due to the marking (the selection drawings) which items are to be selected and transfers the information to the QlikView Listbox, which actually selects them. From a certain number of selected items on a Listbox can do this a lot faster than any Extension.
|
 click to expand |
|||
polygondimensionlistbox QV-listbox ID ID of the QlikView Listbox containing the Dynamic Map/Polygon Dimension empty value feature disabled (default) |
This feature changes the way the selection works and causes a huge performance benefit. Technical background: When using this feature, the selection won't be made by NPGeoMap but by the QlikView Listbox. NPGeoMap just determines due to the marking (the selection drawings) which items are to be selected and transfers the information to the QlikView Listbox, which actually selects them. From a certain number of selected items on a Listbox can do this a lot faster than any Extension.
|
click to expand |
|||
|
1 infobox displayed when drawing (default) 0 infobox not displayed |
Enables or disables a infobox while drawing the marking for a selection. rectangle: width, height, area
|
 click to expand |
|||
showsketchinfo 1 info displayed in marking drawings (default) 0 info not displayed |
Enables or disables the information displayed in the drawn marking. rectangle: width, height, area
|
 click to expand |
|||
sketchfillcolor color fill color of marking drawings (default is #242323) |
Defines the fill color of the markings (selection drawings).
|
 click to expand |
|||
|
1 toggle selection mode enabled 0 toggle selection mode disabled (default) |
Activates toggle selection mode. oToggle selection - same selection dynamics as in Qlik Sense: oDefault selection - same selection dynamics as in QlikView: Further above there's a related feature toggleselection to display a flip switch in the object, which allows the end user to switch dynamically between default and toggle selection. Using the flip switch overwrites the configurations in this feature. |
click to expand |
|||
|
|
||||
|
|||||
coordinatesseperator character Polygon separator of coordinates in source files (default is #) |
This feature informs the system which character is used as Polygon separator in the source files of the coordinates. |
||||
labeloutlinecolor color color for the outlines of labels (default is white) 0 no outline for labels |
This feature renders a outline for labels. It increases the contrast and improves the readability of labels on the map. When setting colors you can use Hex-Codes, HTML color names or RGB |
left side - white outline, |
|||
doubleclickspeed number double click speed in milliseconds (default is 400) |
Defines the maximum allowed time between two single clicks considered as a double click. A double click in the background of the map zooms in one level and a double click on a dynamic item (Marker, Lines, Spheres, etc.) triggers a instant single selection. |
||||
|
1 PopUps will be closed automatically (default) 0 Several PopUps can be open at the same time |
This Feature will close PopUps automatically. If a PopUp is opened, while another one is already open, the previous one will be closed automatically. Only exception is the use of PopUps with dynamic Charts (see popupvariables) as they're related to their respective item. Therefore PopUps with Charts always use autoclose - but it's possible to additionally open PopUps without Chart content, when this feature is disabled. |
||||
popupclosepanmap number Type of map behavior after closing a PopUp (default is 0) |
This setting steers the behavior of the map view, after closing a PopUp (with "x"). type 0 = no shifting or panning at all type 1 = map shifts back to the previous position (before the PopUp was opened) type 2 = map zooms and shifts back to starting position (like a refresh) If the PopUp isn't closed with the "x" in the upper right corner, but with clicking again on the respective object, no movement will happen. And if instead of closing the open PopUp another one is opened (what causes a closing of the currently open PopUp - see feature "popupautoclose" above), a movement only happens, when the new one is again very big or near the edge. |
||||
|
0 Marker is assigned to all overlapping Polygons beneath 1 Marker is assigned to only one unique Polygon (default) |
Belongs to the Menu Button markerinpolygons (further above). |
||||
|
|
||||
This section is for basic chart settings. You can configure NPGeoMap Charts for Dynamic Markers, Endmarkers and Dynamic Maps. |
 click to expand |
||||
exportenabled 0 feature disabled (default) 1 feature enabled |
Only for PopUp Charts: |
 click to expand |
|||
animationenabled 0 animation disabled 1 animation enabled (default) |
Only for PopUp Charts: |
||||
animationduration number duration of the animation in milliseconds, number from 0 to 5000 (default is 800) |
Only for PopUp Charts: |
||||
barchartsbevelenabled 0 no gloss effect on bar charts (default) 1 gloss effect on bar charts |
Only for Bar Charts: |
|
|||
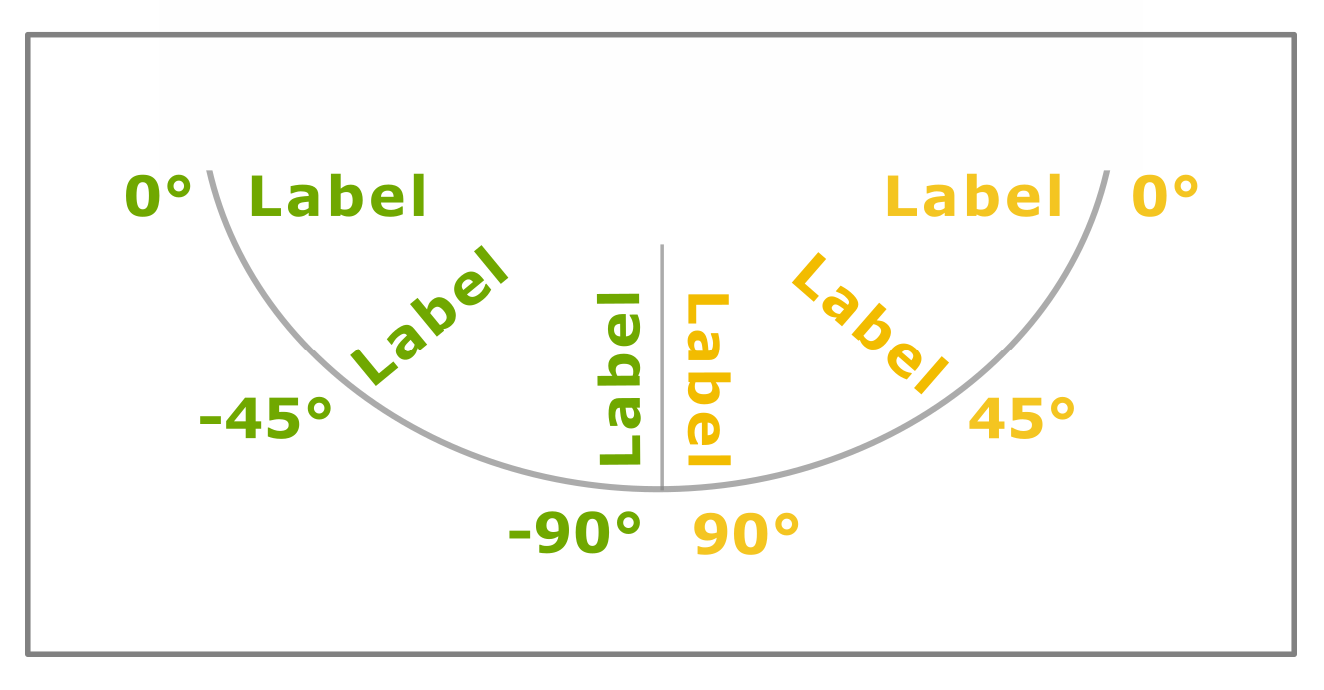
The following settings affect the markings directly in the charts - the lettering along the axes with bar charts and the ones pointing at the pie chart pieces. The label above the chart is the title and can be edited with HTML in the fx‑editor dialogs. |
 click to expand |
||||
labelfontcolor color label font color (default is grey) |
Label font color. When setting colors you can use Hex-Codes, HTML color names or RGB |
||||
labelfontsize number label font size in pixel (default is 14) |
Label font size in pixel. |
||||
labelangle number label angle in degrees, number from -90 to 90 (default is -30) |
Label angle:
|
||||
|
color editable default colors for chart elements, default is: |
If there are no specified color settings for the chart elements, the ones set in this feature will be used. When setting colors you can use Hex-Codes, HTML color names or RGB |
||||
#8daacb #fc7362 #bbd854 #ffd92f #66c296 #e5b694 |
|
||||
|
|
||||
Default colors for dynamic Polygons. |
|||||
colors color editable default colors for dynamic polygons, default is: |
If there are no specified color settings for Polygons in Dynamic Maps or Simple Maps, like Color-Mix (QlikView formula), Choropleth or other dynamic color settings, the colors set in this feature will be used. When setting colors you can use Hex-Codes, HTML color names or RGB |
||||
#DEB887 |
|
||||
|
|||||
active 0 highlights disabled (default) 1 highlights enabled color color color for highlight effect (default is #4679BD) |
Enables or disables an effect which highlights dynamic Polygons when the cursor hovers on them.  click to expand In case the color of the highlight is to similar to the object color (or the same), the highlight color can be set as well - even to get a better contrast. When setting colors you can use Hex-Codes, HTML color names or RGB |
||||
|
|
||||
Expert setting for Radial Spheres. |
|||||
confirmationmessage 0 no message (default) true message will appear |
This feature can show a message every time a Radial Sphere is added manually to the map. The message "Add Radial Sphere at this point?" helps to prevent the accidental adding of circles. |
||||
|
|
||||
Expert setting for Line Bar Charts. |
|||||
locksizezoomlevel -1 feature disabled (default) number zoom level |
When Line Bar Charts are configured, this feature changes the way the Bars respond when zooming. This guarantees optimal visibility of the Line Bar Charts in every zoom level. |
||||
|
|
||||
Custom layer names. |
|||||
caption text custom names for the layers, Dynamic Marker Dynamic Map Static Marker Static Map Lines (intersect) Heat Map Radials Images and Charts |
All layers in the object can be given custom names. See details about the distinction of "Lines (intersect)" and "Paths (enclose)" in the selection hints. |
click to expand |
|||
|
activation 0 animation off (default) 1 manual animation 2 automatic animation 3 automatic animation, only once type number kind of animation effect for these objects duration number duration of animation in milliseconds for these objects animatepartial 0 static objects and hexagons will be animated all at once 1 static objects and hexagons will be animated one after another in an automatic order (as they come from QlikView) |
Objects in NPGeoMap can be animated. owhich Objects are animated and which are not, oin which way they are animated oand in which order. |
 click to expand and animate |
|||
Once set, you can control/steer the animation with the Animation Menu, to reset, start, pause, stop and to repeat/loop the animation (from left to right). Further above in the section "menu" you may turn it off/hide it as well.
In the feature "AnimID" in Dynamic Markers, Dynamic Endmarkers, Lines and Dynamic Maps an ID can be set to configure the order in which objects are animated. activation The settings type and duration are listed for every object group in the dialog: duration animatepartial Object groups/layers to animate: |
|||||
marker - set order markernote* endmarker - set order endmarkernote* staticmarker lines - set order hexagons staticmap dynamicmap - set order mapnotes* |
|
||||
*The Notes for Dynamic Markers, Dynamic Endmarkers and Dynamic Maps may be animated with a different effect and duration as their belonging Markers and Polygons, but as they belong to the same object, not separately. So the order of animation can only be set for Dynamic Markers, Dynamic Endmarkers and Dynamic Maps themselves - the animation of their respective Notes will start at the same time.
Effects - Animation Types: |
|||||
type = 1 |
type = 2 |
type = 3 |
|
||
fade in |
fly in |
scale in |
|||
 click to expand and animate
|
 click to expand and animate |
 click to expand and animate |
|||
type = 4 |
type = 5 |
type = 6 |
|||
pulse |
scale in 360 |
follow path (only for Lines and Paths) |
|||
 click to expand and animate |
 click to expand and animate |
 click to expand and animate |
|||